
The Cost of Time: How Days on Market Affects Sale Price in Gunnison Valley
A Real Estate Market Study | January 1 – December 31, 2025
By Crested Butte Collection
January 26, 2026
Key Findings
The 60-Day Window
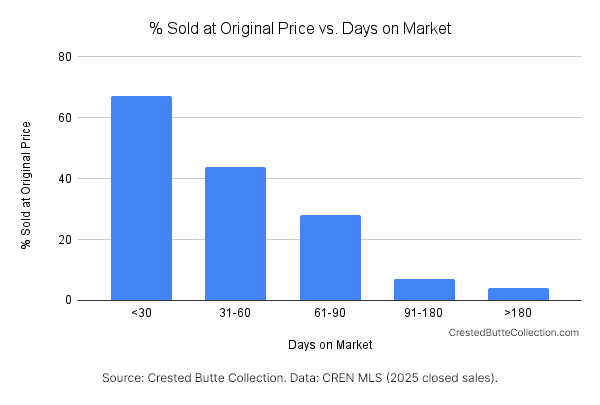
Properties that sold within 60 days were 8 times more likely to achieve their original asking price than those on the market over 90 days.
This isn’t a gradual decline. The data shows a clear threshold: 46% of properties that sold within 60 days received their original price or better. After 90 days, that number drops to 6%.
The 90-Day Cliff
Once a property crosses 90 days on market, the likelihood of achieving original price collapses — regardless of property type or location.
In Crested Butte, not a single single-family home on the market over 90 days sold for original price. Zero out of 30 properties.
In Gunnison, not a single condo/townhome on the market over 90 days sold for original price. Zero out of 22 properties.
In Mt. Crested Butte, not a single condo/townhome on the market over 180 days sold for original price. Zero out of 25 properties.
The Dollar Cost
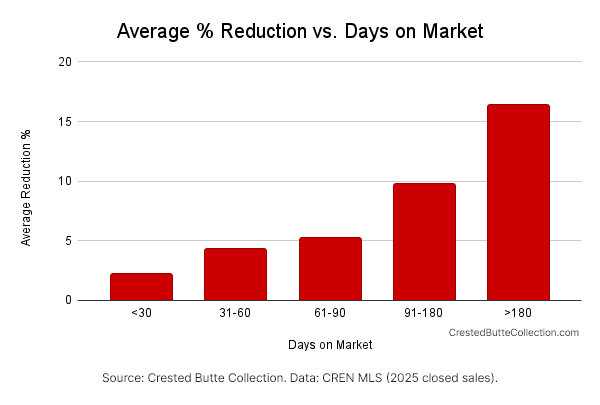
For properties that sold below original price, the average reduction increased with time on market:
Under 30 days: 2% average reduction
31-60 days: 4% average reduction
61-90 days: 5% average reduction
91-180 days: 10% average reduction
Over 180 days: 16% average reduction
For example:
On a $1.5 million Crested Butte home, a 4% reduction at 60 days equals $60,000.
A 16% reduction after 180 days equals $240,000.
In Summary
46% of properties achieved original price within 60 days. 6% achieved original price after 90 days. Average reductions climbed from 4% (31-60 days) to 10% (91-180 days) to 16% (over 180 days).
This study shows correlation, not causation. Properties that sell quickly tend to achieve better prices. But the relationship works both ways — well-priced properties sell faster, and overpriced properties sit longer. Condition, location, seasonality, and pricing strategy all influence days on market. This data describes what happened in 2025. It does not predict individual outcomes.
Single Family Homes – Gunnison Valley
195 properties
Price Range: $260,000 to $11,915,000
| Days on Market | N Sold | At/Above Original | Below Original | Avg % Reduction | Avg $ Reduction |
|---|---|---|---|---|---|
| <30 | 6 | 50.0% | 50.0% | 2.24% | $29,667 |
| 31-60 | 57 | 36.8% | 63.2% | 4.63% | $53,598 |
| 61-90 | 43 | 20.9% | 79.1% | 5.91% | $107,056 |
| 91-180 | 47 | 8.5% | 91.5% | 9.90% | $203,407 |
| >180 | 42 | 2.4% | 97.6% | 18.74% | $286,760 |
Condos + Townhomes
168 properties
Price Range: $150,000 to $3,650,000
| Days on Market | N Sold | At/Above Original | Below Original | Avg Reduction % (below only) | Avg $ Reduction (below only) |
|---|---|---|---|---|---|
| <30 | 3 | 100% | 0% | N/A | N/A |
| 31-60 | 53 | 52.8% | 47.2% | 3.82% | $23,490 |
| 61-90 | 25 | 40.0% | 60.0% | 4.07% | $40,467 |
| 91-180 | 49 | 6.1% | 93.9% | 9.71% | $72,889 |
| >180 | 38 | 5.3% | 94.7% | 13.80% | $163,125 |
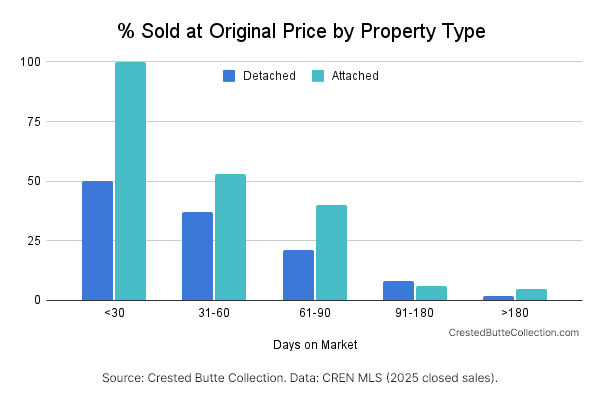
Note: Detached = Single-Family Homes, Attached = Condos/Townhomes
By Location – Single-Family Homes
Crested Butte
61 properties
Price Range: $365,000 to $11,915,000
| Days on Market | N Sold | At/Above Original | Below Original | Avg % Reduction | Avg $ Reduction |
|---|---|---|---|---|---|
| <30 | 1 | 100% | 0% | N/A | N/A |
| 31-60 | 15 | 40.0% | 60.0% | 3.78% | $88,306 |
| 61-90 | 15 | 20.0% | 80.0% | 5.97% | $194,450 |
| 91-180 | 18 | 0% | 100% | 8.86% | $332,472 |
| >180 | 12 | 0% | 100% | 19.07% | $510,229 |
Mt. Crested Butte
15 properties
Price Range: $413,056 to $5,242,000
Small sample size – use with caution
| Days on Market | N Sold | At/Above Original | Below Original | Avg % Reduction | Avg $ Reduction |
|---|---|---|---|---|---|
| <30 | 0 | – | – | – | – |
| 31-60 | 2 | 50.0% | 50.0% | 11.65% | $174,167 |
| 61-90 | 4 | 0% | 100% | 3.10% | $61,500 |
| 91-180 | 5 | 20.0% | 80.0% | 5.09% | $109,375 |
| >180 | 4 | 25.0% | 75.0% | 12.37% | $298,733 |
Gunnison
87 properties
Price Range: $320,000 to $3,300,000
| Days on Market | N Sold | At/Above Original | Below Original | Avg % Reduction | Avg $ Reduction |
|---|---|---|---|---|---|
| <30 | 3 | 66.7% | 33.3% | 0.22% | $1,500 |
| 31-60 | 29 | 31.0% | 69.0% | 4.46% | $40,750 |
| 61-90 | 19 | 15.8% | 84.2% | 6.64% | $61,969 |
| 91-180 | 17 | 11.8% | 88.2% | 11.82% | $115,600 |
| >180 | 19 | 0% | 100% | 17.09% | $193,368 |
By Location – Condos / Townhomes
Crested Butte
42 properties
Price Range: $281,933 to $2,525,000
| Days on Market | N Sold | At/Above Original | Below Original | Avg % Reduction | Avg $ Reduction |
|---|---|---|---|---|---|
| <30 | 1 | 100% | 0% | N/A | N/A |
| 31-60 | 17 | 70.6% | 29.4% | 5.01% | $43,200 |
| 61-90 | 6 | 33.3% | 66.7% | 3.00% | $42,500 |
| 91-180 | 11 | 18.2% | 81.8% | 4.56% | $41,222 |
| >180 | 7 | 28.6% | 71.4% | 13.52% | $139,200 |
Mt. Crested Butte
75 properties
Price Range: $185,000 to $3,650,000
| Days on Market | N Sold | At/Above Original | Below Original | Avg % Reduction | Avg $ Reduction |
|---|---|---|---|---|---|
| <30 | 1 | 100% | 0% | N/A | N/A |
| 31-60 | 13 | 38.5% | 61.5% | 4.70% | $29,469 |
| 61-90 | 14 | 28.6% | 71.4% | 4.47% | $40,600 |
| 91-180 | 22 | 4.5% | 95.5% | 10.48% | $103,666 |
| >180 | 25 | 0% | 100% | 14.62% | $189,020 |
Gunnison
51 properties
Price Range: $150,000 to $965,000
| Days on Market | N Sold | At/Above Original | Below Original | Avg % Reduction | Avg $ Reduction |
|---|---|---|---|---|---|
| <30 | 1 | 100% | 0% | N/A | N/A |
| 31-60 | 23 | 47.8% | 52.2% | 2.74% | $11,291 |
| 61-90 | 5 | 80.0% | 20.0% | 4.36% | $31,000 |
| 91-180 | 16 | 0% | 100% | 11.59% | $50,306 |
| >180 | 6 | 0% | 100% | 10.61% | $75,167 |
Definitions
Original List Price – The price at which the property was first listed for sale. This study compares the sold price to this original price, not to any subsequent price reductions during the listing period.
Days on Market (DOM) – The number of days from when the property was listed until it went under contract.
At/Above Original – Properties that sold for their original list price or higher.
Below Original – Properties that sold for less than their original list price.
Average % Reduction – The average percentage below original list price, calculated only for properties that sold below original price. This excludes full-price sales to isolate the true cost when a property doesn’t achieve its original price.
Average $ Reduction – The average dollar amount below original list price, calculated only for properties that sold below original price.
Detached – Single-family homes on their own lot.
Attached – Condominiums and townhomes that share walls with neighboring units.
Data Notes
This study analyzed 363 closed residential transactions recorded in the Gunnison County MLS between January 1 and December 31, 2025. Land sales, mobile homes, and commercial properties were excluded.
Average reductions were calculated using only properties that sold below original price. Median reductions were also calculated for comparison. Results were consistent, with medians 1-2 percentage points lower than averages across all DOM brackets, indicating no significant outlier distortion.
No properties were excluded as outliers. All calculations use original list price (the first listed price) compared to sold price.
Data analysis by AgentCOS.
About This Study
This study was produced to provide transparent market data to buyers, sellers, and real estate professionals in the region.
Properties Analyzed: 195 detached single family homes and 168 attached properties (condominiums and townhomes)
Price Range: $150,000 to $11,915,000
Locations: Crested Butte, Mt. Crested Butte, Gunnison
Data Source: CREN MLS
Period: January 1 – December 31, 2025
About Crested Butte Collection
The Crested Butte Collection is the leading real estate team serving the Gunnison Valley, including Crested Butte, Mt. Crested Butte, and Gunnison, Colorado.
The group is led by distinguished agents Kiley Flint and Jaima Giles-Alsum, who have both earned remarkable individual distinctions throughout their careers. Kiley and Jaima have consistently ranked among the top agents in Gunnison County, selling over $37M and $36M respectively in 2025. Kiley and Jaima have qualified as top producers for LIV Sotheby’s International Realty for the past several years. They have also both ranked among the top 1.5% of real estate professionals nationwide by RealTrends—a testament to their exceptional performance in a highly competitive industry.
What truly distinguishes The Crested Butte Collection, however, is the synergy Kiley and Jaima, along with their experienced support team, bring to every transaction. By combining their individual strengths, market insights, and decades of collective experience, they provide clients with an unparalleled level of service and strategic advantage. This collaborative approach ensures that every client benefits from dual expertise, comprehensive market coverage, and the attentive, personalized service that defines luxury real estate at its finest.
The Crested Butte Collection stands as the leading real estate team in the Gunnison Valley. Yet, beyond the accolades and sales records lies a deeper commitment—to understanding each client’s unique vision, to honoring the integrity of this remarkable mountain community, and to facilitating transactions with the discretion, professionalism, and attention to detail that luxury real estate demands.
For those seeking to buy or sell distinguished properties in one of Colorado’s most sought-after destinations, The Crested Butte Collection offers an unmatched combination of proven expertise, market leadership, and dedicated personal service.
Relevant Links:
Homes for sale in Mt. Crested Butte
Homes for sale in Crested Butte (Town of Crested Butte, South, and Rural)
Homes for Sale in Gunnison (City and Rural)